Regression methods
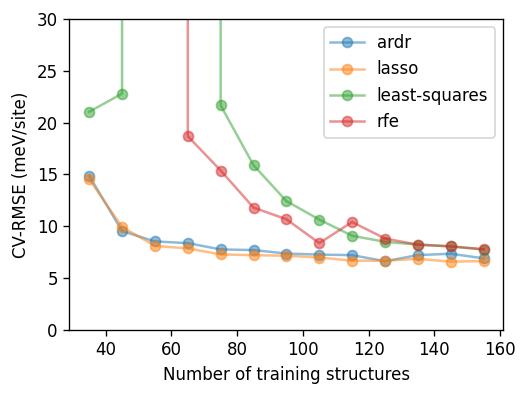
In this notebook we compare different regression methods with respect to their ability to extract cluster expansion parameters as a function of training set size. The accuracy of the models is evaluated using the CrossValidationEstimator.
In the following cell we set up the cluster space and compile the structures from the randomized training set.
[1]:
from icet import ClusterSpace, StructureContainer
from ase.io import read
from ase.db import connect

# set up ClusterSpace and StructureContainer
cutoffs = [9.0, 5.0]
prim = read('../structures/MoC_rocksalt_prim.xyz')
chemical_symbols = [['C', 'Be'], ['Mo', 'V']]
cs = ClusterSpace(prim, cutoffs, chemical_symbols)
sc = StructureContainer(cs)

# collect training structures
db = connect('../dft-databases/rocksalt_MoVCvac_randomized.db')
for row in db.select():
    structure = row.toatoms()
    sc.add_structure(
        structure,
        properties=dict(mixing_energy=row.mixing_energy))
A, y = sc.get_fit_data(key='mixing_energy')
Next, we run construct the learning curves using the different regression methods.
The following cell can take a few minutes to run. Since some of the fits end up being (very) poorly conditioned you will see a fair number of warnings concerning large condition numbers and incomplete convergence. In the online version these warnings have been removed to avoid clogging the notebook.
Also note that in order to obtain well-converged results one should increase the number of cross-validation splits.
[2]:
%%time
import numpy as np
from pandas import DataFrame
from trainstation import CrossValidationEstimator

# range of training set sizes to consider
train_size_values = np.arange(35, 160, 10, dtype=int)

# number of splits used for cross validation
n_splits = 5

# method-specific fit parameters
fit_methods = {}
fit_methods['least-squares'] = dict()
fit_methods['lasso'] = dict(max_iter=50000, tol=1e-4, alphas=np.logspace(-4.0, 0, 25))
fit_methods['ardr'] = dict(line_scan=True, threshold_lambdas=np.logspace(1.5, 5.5, 75))
fit_methods['rfe'] = dict(step=1)

data = []
for fit_method, fit_kwargs in fit_methods.items():
    for train_size in train_size_values:

        # run cross validation
        cve = CrossValidationEstimator(
            (A, y), fit_method=fit_method, n_splits=n_splits,
            train_size=train_size, validation_method='shuffle-split',
            **fit_kwargs)
        cve.train()
        cve.validate()

        # compile results
        data.append(dict(
            fit_method=fit_method,
            train_size=train_size,
            n_parameters=cve.n_parameters,
            n_nonzero_parameters=cve.n_nonzero_parameters_splits.mean(),
            rmse_validation=cve.rmse_validation,
            rmse_train=cve.rmse_train,
        ))

df_all = DataFrame(data)
Warnings ...
CPU times: user 7min 39s, sys: 15min 42s, total: 23min 21s
Wall time: 6min 14s
[3]:
from matplotlib import pyplot as plt

fig, ax = plt.subplots(
    figsize=(4.5, 3.4),
    dpi=120,
)

for fit_method, df in df_all.groupby('fit_method'):
    ax.plot(df.train_size, 1e3 * df.rmse_validation,
            '-o', label=fit_method, alpha=0.5, ms=6)

ax.set_xlabel('Number of training structures')
ax.set_ylabel('CV-RMSE (meV/site)')
ax.set_ylim(0, 30)
ax.legend()

fig.tight_layout()
